All good marketers and bloggers know that infographics are vital for producing good content or to get the message across as clearly as possible. They are simple to comprehend and they are instantly visible. With the right tools, you can basically cram a whole article’s topic into one single picture and your target audience will digest it in a matter of seconds.
In short, these graphs are used to depict a great amount of information in a single picture. It’s a great way to get your message through quickly since modern readers tend to look for instantly accessible and brief info.
Also, graphics sometimes make more sense than lengthy paragraphs and it’s a quicker and simpler way to get your message across.
It’s like infographics are a gift sent from the heavens. However, they could be a curse too. In a world where they are becoming a blogging and marketing standard, you’ve got to be careful and present them in an appealing and precise way. Luckily, the internet has all the tools you need.
Why Bother About Infographics?
They have become one of the most popular marketing tools in the digital realm. Not joining the marketing bandwagon would mean that you might be jeopardizing your website’s traffic and thus, your leads and conversions.
But still, why??
- Consumer habits have changed – we process a lot more information that the generation before us, meaning, today’s users would rather engage in something that’s quickly digestible.
- Marketing studies have found that around 45 percent of users will click on content featuring infographics
- It’s great for getting inbound links
- It’s not only easier for the reader. Creating an infographic most often will be less time-consuming than producing “classic” written content. Especially when you’re using the right tools.
Our Choice of the Top 12 Online Infographic Generator Tools
Luckily, the world wide web’s always ready to help us out and make our job easier. Having to mingle with Photoshop and other programs can make the whole process a lengthy nightmare, especially, when we’re new to the software.
Instead, here are a few really cool online tools for creating infographics that will help you improve your content in no time.
Easel.ly
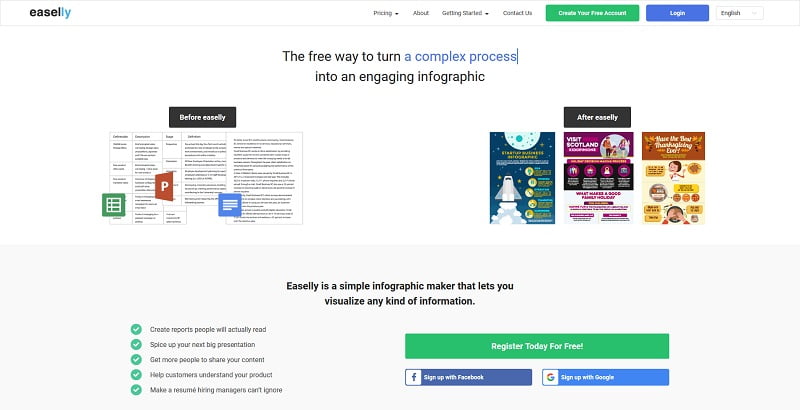
With this tool, you’ll only need a few clicks to put together a great and comprehensive image.
Just pick a template from their huge inventory. Use the drop-down menu to further filter your template options and opt for something topic-specific if you like.
After that, you can further customize your image with different backgrounds, objects, text, and shapes.
What’s the best part? This tool’s base version is totally free, so you can get down to business in a blink of an eye.
Visme.co
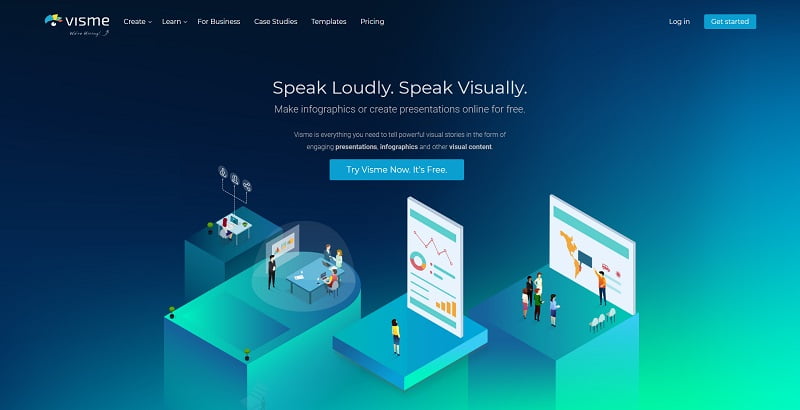
Visme is also a really handy little tool that allows you to get creative with your infographics. It could also help you with presentations, animations, ad banners, and much more.
You could also go the simple route, and create your image with a few simple clicks. It’s an awesome package for creating engaging visual stories.
PiktoChart
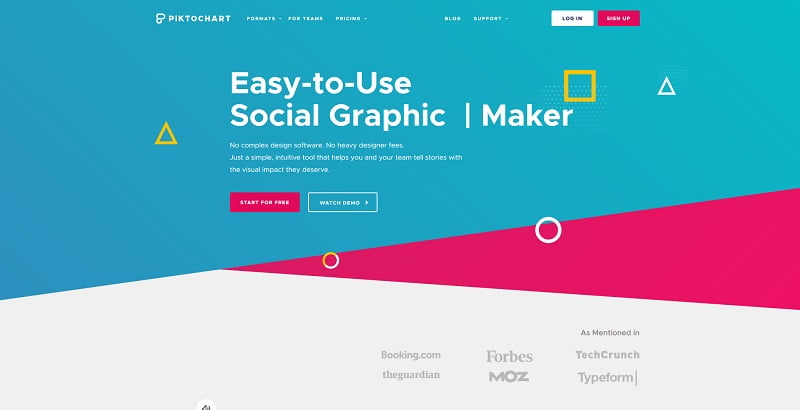
With over 400 fully customizable themes, with awesome images, graphs, and a wide array of different colors, PiktoChart might be the number one infographic designer tool for those who know only a little or nothing about graphic design.
It’s fairly simple to use and it can hook you up with everything you need in less than 10 minutes. That’s always a winner when time’s a factor.
Adobe Spark
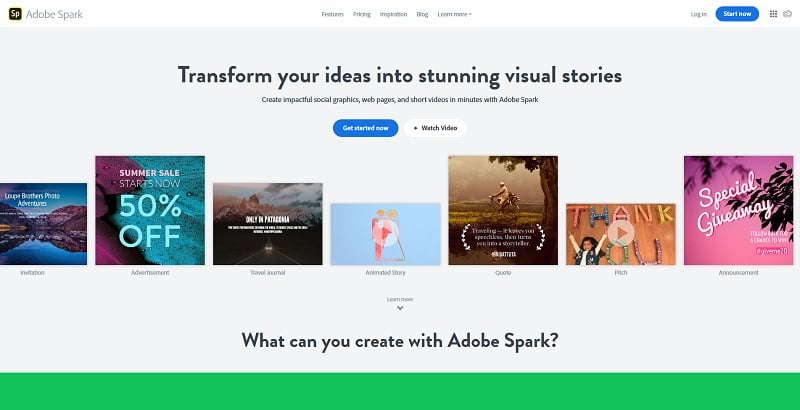
Adobe’s online tool also offers a lot of cool features to create the infographic you need. With no design skills necessary, Adobe Spark will set you up with loads of unique templates to choose from, outstanding customization options (unique fonts, your photos, etc) to create eye-catching infographics every time.
Lastly, it’s from Adobe – with all the professional design options you’ve come accustomed to with the software.
Snappa
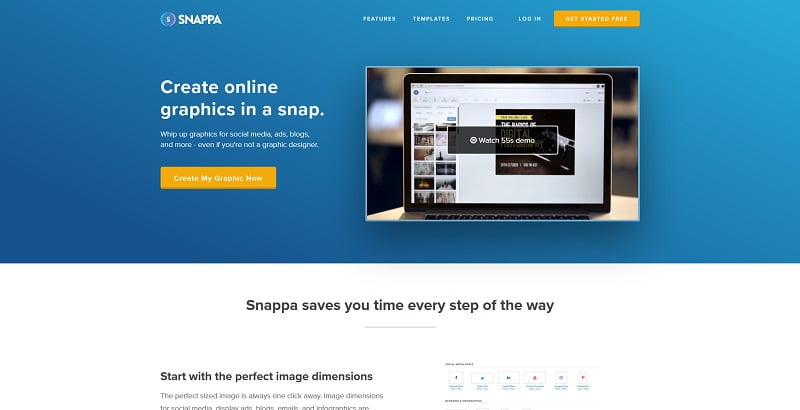
Offering a large size of presets on click, thousands of pre-made templates, and over a million high-resolution stock photos to choose from, Snappa is another great online tool that will get the job done in no time.
A great feature is the ability to schedule and post your visual creations on popular social media channels without leaving the platform, saving you even more time in the process. That’s a clear win in our book.
Visualize.me
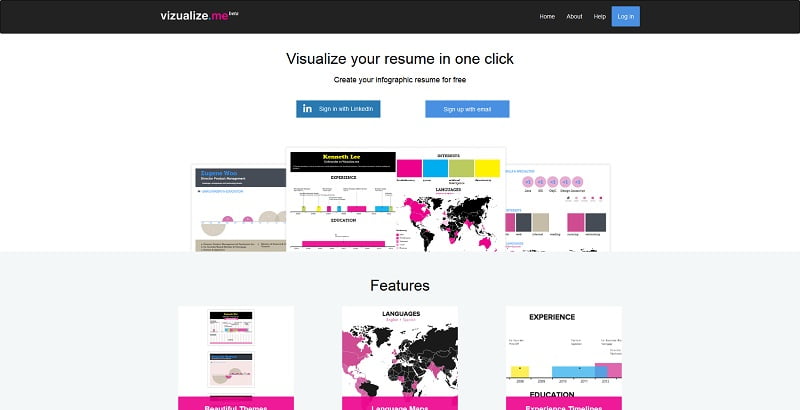
This tool is more focused on creating “infographic resumes” but that’s not its only purpose.
Just simply sign in with your email account and start browsing from different templates and formats to create the infographic that is most suited for your current needs.
Canva
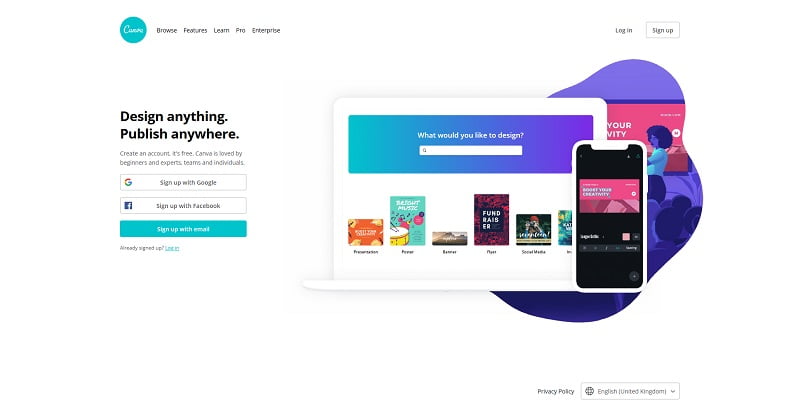
First of all, Canva’s website has a brilliant design – tempting both designers and other users who are keen to get creative and even artistic with their content.
Learn the basics with the tool’s tutorial and once you’re ready with that, dive in headfirst into creating the retina-ready infographic you need. You can also create your business card, presentation, poster, banner, even your Facebook cover photo.
Venngage
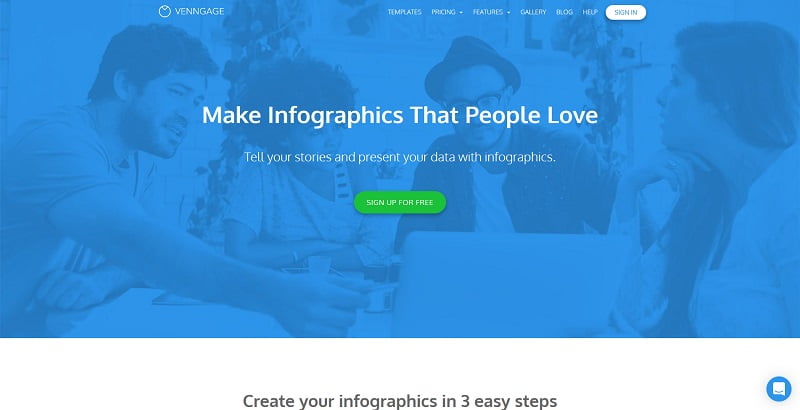
Venngage is your one-stop infographic generator tool from creating to publishing it – on the spot.
Choose from hundreds of professional templates to get started. Once you’ve mastered that area, you can move on to designing your own posters, reports, and promotions. It also allows you to create your “visually engaging” posts on social media by using maps, charts, different visuals, and icons.
Infogram
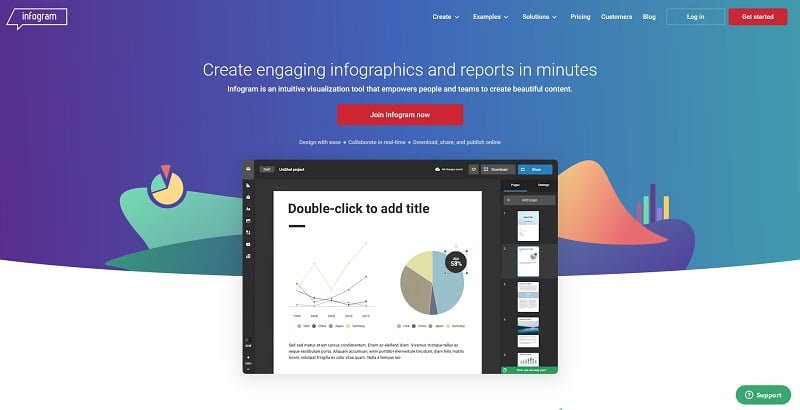
This tool is all about creating infographics the easiest and the quickest way possible.
It’s ideal for teachers, bloggers, entrepreneurs or for any kind of organization to create comprehensive infographics in three simple steps.
Timetoast
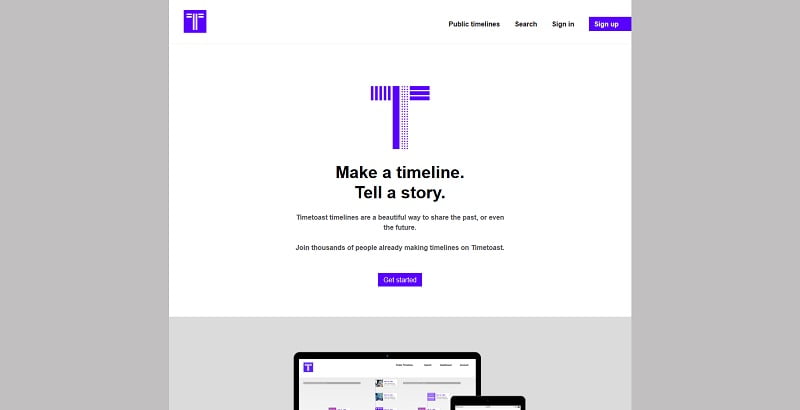
Create digital timelines with this handy little tool. If a timeline-based infographic is what you need, look no further!
Google Charts
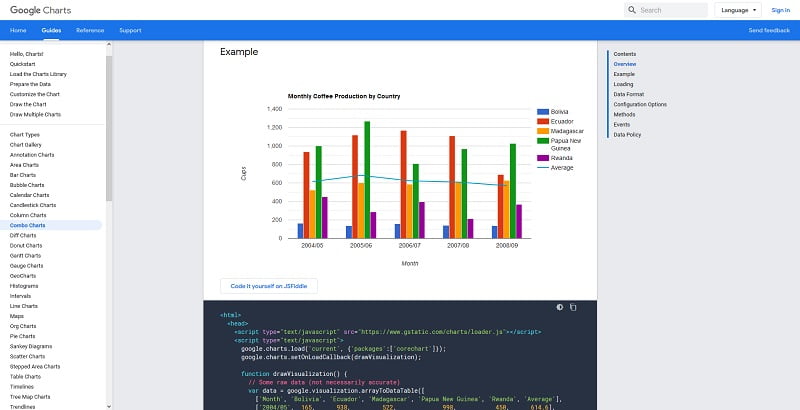
What about Google Charts? Chances are, you’ve already used it, and you know that you don’t need extensive training to use it efficiently.
It’s a straightforward tool allowing you to use different maps, bars, charts, and other statistical elements to create the infographic you need.
Charts Bin
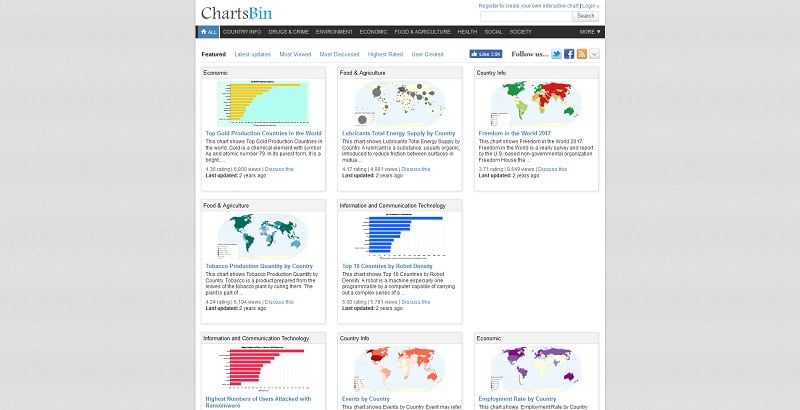
This is a free online tool that lets you mingle with interactive maps. Just insert values to create your map, then use the simple “copy & paste method” and insert the embedded HTML code to your website. A hassle-free and easy trick to display the infographic on your site.
Summing It All Up
As you can see, there are tons of different useful tools for you to create visuals that you need. Which one is the best, you ask?
Well, all of these are useful, easy to use, and let you express your own creativity. It all boils down to personal preference.
If you are someone who wants to get infographics out of the way quickly, Google Charts may be the all-in-one solution you’ll ever need. If you’re looking for something more flashy that allows you to make adjustments in real-time, iCharts is the tool you might want to use.
All in all, the decision is yours. As long as you are satisfied with the outcome and you like the user experience, you can’t go wrong with any of these tools.
At the end of the day, what you should keep in mind is your readers and potential customers. If it appeals to them, then just keep up with the good work.