If you’ve dabbled any time with web development and applications, you know that maintaining a cohesive and continuously well-performing online presence isn’t a fly-by-night process. Once you’ve launched your website or application, the lion’s share of the work may be done, but that doesn’t mean that you can leave your site as it is and reap all its benefits.
Apart from basic website maintenance, you also need to keep an eye on web application performance metrics. These key application performance metrics help you keep track of what’s happening on your website, both in a technical sense and from the aspect of user experience.
So, what performance metrics should you be tracking in your web application? In this article, we aim to shed more light on the metrics you need to focus on and discuss valuable tips that will help you improve them.
Performance Metrics in Web Applications: What Are They?
Web application performance metrics are indicators that help you track and measure how your software performs. Regarding performance, you can keep an eye on several different aspects, from user experience to reliability and responsiveness and more.
At first glance, this sounds pretty obvious, right? Still, why are they so important that they deserve a blog post of their own?
To get started, web application performance metrics ensure that web application development services function at the highest level but also ensure your team addresses any issues with the platform in a timely manner and proactively. This is especially vital in cases when the application is the sole heart of your entire business.
Continuous monitoring of these metrics helps you and your team:
- Identify errors and fix them before they negatively impact user experience
- Avoid downtime
- Ensure optimal application performance
- Keep user satisfaction high
- Drive more growth and enable faster business scaling.
Still, it’s also important to remember that monitoring every single performance metric can be counter-productive, as it can hog up too many resources and time. This is why focusing on the right web app performance metrics is essential to understanding the basics of owning an optimal, business-focused platform on the Internet.
Key Application Performance Metrics
So, what are the most vital metrics you want to measure? Here’s a rundown of the most helpful insights you should be keeping an eye on.
1. Apdex Scores and User Satisfaction
The Apdex score or application performance index has become the standard for measuring an application’s relative performance.
The score operates by defining a target duration for a particular web request or transaction. These transactions are categorized into fulfilled (quick), accepted (slow), excessively slow, and unsuccessful requests. Subsequently, a basic mathematical formula is employed to generate a score ranging from 0 to 1.
In simpler terms, the score measures response times, compares them against predefined thresholds, and categorizes them into unsatisfactory and satisfactory response times.
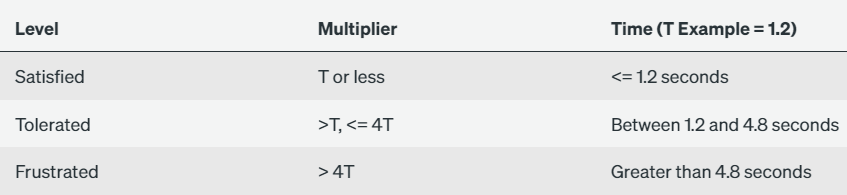
For example, if you have a defined threshold of T, and every response that has been carried out in or less than T is a satisfactory response. On the other hand, those responses that have taken more are considered unsatisfactory.
More specifically, the Apdex score defines three different user types based on satisfaction. These are:
- Satisfied: High responsiveness
- Tolerating: Slow yet expectable responsiveness
- Frustrated: Unacceptable responsiveness.
2. Error Rates
Errors are the last thing you and your users want to see. Even though progressive web app development and other advancements have managed to eradicate a myriad of problems, there are still three potentially dangerous errors that you need to track:
- Logged exceptions: These are the number of logged and unhandled application errors.
- HTTP error: these are the web requests that finally ended up as errors.
- Thrown exceptions: this is the number of all thrown exceptions.
In the latter case, it’s not uncommon to see even thousands of ignored and thrown app exceptions, but those hidden can lead to several performance issues.
Remember, sudden spikes in these errors usually suggest that a major failure can occur soon. Monitoring these rates can enable you to see how often your app manages to fail in real-time. Keeping an eye on errors is also an important way to fix anything serious in time before it turns into something more serious that can crash the entire platform.
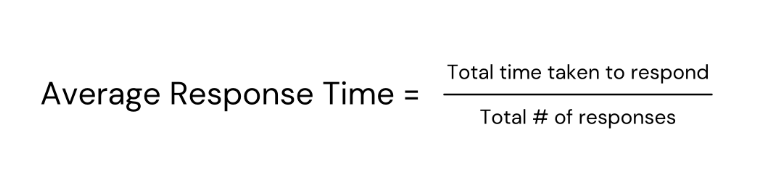
3. Average Response Time
You can calculate your average response time by averaging the time of all of the requests your site gets in a predefined time period. A low average response time means that your platform is performing optimally because the server needs less time to respond to every input or request.
However, some experts may advise that site owners spend less time calculating average response times to measure overall performance and try to rely more on their site’s Apdex scores to gain overall performance insights. Still, that doesn’t mean that one should totally overlook the importance of averages.
4. Security Exposure
Security has become an integral part of web development. Nowadays, site owners need to ensure that the application, the data on the website, and user information are all safe in the digital realm.
That said, to improve overall performance, ensure that you are running the latest security protocols and also determine how much of your system is unsecure or even exposed. Naturally, to keep everything safe, you should also have an emergency plan if certain security vulnerabilities get penetrated.
Remember, security is an integral part of overall user experience and satisfaction. Visitors want to keep their sensitive data safe, meaning that they probably don’t leave any credentials, personal information, or financial data on your website if they deem it unsafe.
Also, a massive data breach can lead to massive lashbacks and a major stain on your business’ credibility that will be challenging (or even impossible) to recover from.
5. Application Availability
Another app performance metric businesses will usually track is application availability, which means measuring and monitoring whether your app is available online. As a matter of fact, several companies use this metric for SLA or uptime for service-level agreements.
The easiest way to measure this is by scheduling a simple HTTP check. On the other hand, some companies will offer services that will also monitor status codes, response time monitoring, and more.
6. Request Rates
Your app’s success also depends on understanding the amount of traffic it receives. Also, most of the time, other performance metrics are directly affected by traffic decreases and increases.
Tracking request rates can be a fantastic way to look for inactivity spikes, which may often indicate a simple error or even a more serious problem that needs immediate attention. On the other hand, getting a better idea of your app’s request rates can help you understand the basic dynamics of your app.
Furthermore, you may also want to keep an eye on requests per minute. Tracking these can give you a better understanding of how your server manages to perform under different circumstances. On that note, you should also track bytes per request or the amount of data your app needs to handle during these requests. In some cases, the app may get more requests than it can effectively handle, which can decrease overall app performance.
7. CPU and Memory Usage
When you are dealing with high server CPU usage, you will most likely face problems with other app performance metrics as well. Server and application CPU monitoring is essential for ensuring that everything runs smoothly.
Why? Because high CPU usage will affect app resnponsiveness. High CPU usage also means that the app is slow, i.e., spending way too much time on computing, compromising responsiveness. Spikes may also signal that the CPU has managed to reach its threshold.
Fortunately, there are several app monitoring tools that will track CPU usage and give out regular alerts. Experts usually recommend running these tools per server, but in some cases, they may be useful for your apps individually deployed instances.
Memory usage is another critical web app performance metric, as it shows how your app is managing its resources while running or executing requests. Naturally, high memory usage is a clear sign of high resource allocation in the server. Experts usually recommend keeping an eye on disk access times and page fault numbers.
On another note, you should also know that memory usage has both financial and technical implications.
As far as technology goes, high memory usage can lead to memory leaks, resulting in decreased scalability and performance, leading to increased latency, slower response times, more frequent crashes, and app downtime. On the note of finances, high memory usage will usually require other costs like increased cloud storage expenses or additional hardware upgrades.
Garbage collection introduces temporary pauses and consumes considerable CPU resources, necessitating a focus on assessing and optimizing its performance within your application.
Key metrics for gauging garbage collection performance include
- GC Handles: Tallying the total count of object references generated in an application
- Percentage Time in GC: Reflecting the percentage of time spent on garbage collection since the last GC cycle, providing insights into overall application responsiveness
- Garbage Collection Pause Time: Measuring the duration of the application’s complete pause during a GC cycle, encouraging minimization by limiting objects marked for collection
- Reclamation Rate: Assessing the pace at which instances are generated or reclaimed within an application, with a higher rate potentially elevating CPU utilization
- Garbage Collection Throughput: Signifying the percentage of total time the application dedicates to tasks other than garbage collection, highlighting overall efficiency.
Effective monitoring of these metrics is crucial for maintaining optimal application performance, and tools like Retrace offer seamless capabilities for tracking and analyzing garbage collection metrics.
8. Uptime and Latency
Latency is the delay that takes place between the user’s action and the app’s response to said action. Latency is usually measured in milliseconds, and it can affect app load times. To keep an eye on latency, experts usually suggest taking advantage of ping services, which can run checks at specific intervals.
How To Improve Web Application Performance
Minifying or Bundling Files
Optimizing your files and reducing their numbers can help with improving overall app performance. Minifying means reducing the size of your files, while bundling refers to combining them to keep their overall numbers in check.
The Advantages of Network Caching
Caching is also often used to improve latency and throughput (a metric that measures how many information units can your app process in a given timeframe). Caching can be best described as creating a temporary data storage for faster access to information that the system has fetched already.
Static or frequently changing resources, like CSS stylesheets, JavaScript files, and pictures, can all be potential resources for caching.
Among the client and server, various caches are accessible, ranging from browser and application caches to content delivery networks (CDNs) and reverse proxies situated in front of an application server. Caches can be categorized based on their access level into two groups—private (accessible solely to individual users) and shared (available to multiple users).
Use Prefetching Techniques
These techniques will usually include reading and completing instructions before user initiation. This is a common and effective way to anticipate user requests, and in some cases, it can load content and some links in advance.
In most cases, contemporary browsers automatically enable prefetching, relying on assumptions about user behavior patterns. UX engineers and specialists, who possess insights into user behavior, often generate “hints” for browsers to facilitate prefetching processes.
There are three typical prefetching types:
- Prerendering – This means that certain elements of a page (or the entire page) are rendered in advance.
- DNS-prefetching – This means in advance domain resolving into IP addresses.
- Link prefetching – This becomes beneficial when you are confident that a user will use a particular link to navigate to a specific page. This approach proves advantageous for consistent user journey actions, such as accessing the shopping cart page after adding items.
Generally, prefetching is effective, but only if you form accurate assumptions. And for that, you need to conduct the necessary research and have the required user behavior analytics.
Finishing Thoughts
Effectively managing and scrutinizing application metrics transforms seemingly obscure technical data into a comprehensible narrative. This narrative not only sheds light on the system’s reliability but also offers valuable insights into the overall user experience.
By delving into application metrics, one can decipher patterns, identify potential bottlenecks, and fine-tune performance for optimal functionality. This process ensures that meaningful information is extracted from the intricate web of data, contributing to a more user-centric and efficient system.
Ultimately, the practice of regularly reviewing application metrics becomes integral to maintaining a robust and user-friendly software environment.